You are using an out of date browser. It may not display this or other websites correctly.
You should upgrade or use an alternative browser.
You should upgrade or use an alternative browser.
Predictions For 2024 Sales Market
- Thread starter David Goldsmith
- Start date
any more predictions for this year? anyone?
Sales pace will be low, at or below Q4 2022 pace.
Supply for sales will increase, driven primarily by properties w/o a mortgage, as rates have increased the attractiveness of cash over a stagnant sales market.
Supply for rent will increase, driven by economic headwinds and would-be sellers with mortgages reluctant to lose large portions of their downpayment and low-rate mortgages.
I def agree with point 1. Regarding point 2/3, logical for sure and makes sense, but I wonder if supply will be tight on both sides of the ball for the year ahead as price action is lower than peak levels...will sellers not want to list if they cant get their bid?
Or, will a downturn swell inventory as demand activity stays low?
I do worry about a 2nd wave down in credit/equity markets which would put us in another cycle down, all eyes on the Fed and that terminal and post terminal curve..markets expecting few cuts by end of year, hmm, not sure about that
Or, will a downturn swell inventory as demand activity stays low?
I do worry about a 2nd wave down in credit/equity markets which would put us in another cycle down, all eyes on the Fed and that terminal and post terminal curve..markets expecting few cuts by end of year, hmm, not sure about that
There's been tons of stuff taken off market for the past several years. Between interest rates going up and rental rates apparently going down this could squeeze owners into listing. Even if they bought all cash it's going to be much harder to keep tons of equity earning nothing when now you can get four plus percent on a CD. Because now you lose just by holding in opportunity costs.
What David said. A lot of money went into assets earning little yield because of a belief in TINA. After 15 years of ZIRP, the idea of 4% risk-free rates is starting to sink in. Sure, you can sit out the market for 5 years to eventually get your price. But you’ll lose the opportunity for 20% interest, risk-free, in the meantime. That calculation used to be 0%.
Here is something that showed up for rent today that is emblematic of the situation:

 streeteasy.com
It has been for sale on-and-off, first in 2019-2020 and then again since mid-2022:
 streeteasy.com
Original ask of $16M seemed awfully aspirational compared to 2013 purchase at $10M. But they were willing to wait for the right buyer. Now, price is down to $12M. After negotiations and transaction costs, they’re hoping to get just the $10M back. Presumably, they haven’t had much traction on that — hence the rental listing.
Is $55K/mo gonna happen? I doubt it. But where did that number come from? After a decade of I/O payments at 2% on a $6.5M loan ($11K/mo) plus $13K/mo in CC + taxes, the loan just reset to ~7%. It looks like it’ll be staying there for years, at $38K/mo in interest. So $51K monthly nut now…
The choices don’t look great:
1. Hope someone bids on the $12M ask, so you get your $3.5M back and break even. Never mind the 30% inflation increase during the interim.
2. Hope someone rents it, paying double the market rate, allowing you to sit it out without bleeding
3. Spend $51K/mo while it sits on the market, for who knows how long. That’s $600K/yr.
4. Cut to market rent, reducing bleed to $300K/yr, for a few years hoping the market turns.
5. Cut your losses by reducing ask to a market-clearing price, losing half your downpayment.
6. Throw cash at it to reduce interest. Cash that could be earning 5% risk-free elsewhere.
For Rent: 21 East 26th St. #3 in NoMad
21 EAST 26 STREET #3 is a rental unit in NoMad, Manhattan priced at $55,000.
streeteasy.com
It has been for sale on-and-off, first in 2019-2020 and then again since mid-2022:
For Sale: 21 East 26th St. #3 in NoMad
21 EAST 26 STREET #3 is a sale unit in NoMad, Manhattan priced at $11,995,000.
streeteasy.com
Original ask of $16M seemed awfully aspirational compared to 2013 purchase at $10M. But they were willing to wait for the right buyer. Now, price is down to $12M. After negotiations and transaction costs, they’re hoping to get just the $10M back. Presumably, they haven’t had much traction on that — hence the rental listing.
Is $55K/mo gonna happen? I doubt it. But where did that number come from? After a decade of I/O payments at 2% on a $6.5M loan ($11K/mo) plus $13K/mo in CC + taxes, the loan just reset to ~7%. It looks like it’ll be staying there for years, at $38K/mo in interest. So $51K monthly nut now…
The choices don’t look great:
1. Hope someone bids on the $12M ask, so you get your $3.5M back and break even. Never mind the 30% inflation increase during the interim.
2. Hope someone rents it, paying double the market rate, allowing you to sit it out without bleeding
3. Spend $51K/mo while it sits on the market, for who knows how long. That’s $600K/yr.
4. Cut to market rent, reducing bleed to $300K/yr, for a few years hoping the market turns.
5. Cut your losses by reducing ask to a market-clearing price, losing half your downpayment.
6. Throw cash at it to reduce interest. Cash that could be earning 5% risk-free elsewhere.
I can't imagine what condo board meetings in that building are like.
jeffrey lynch
New member
noticing the market pulse for the BK has drifted lower in the last month or so by 7 basis points or so while Manhattan has only drifted by only 3 basis points.
I'm not sure "basis points" is the right term but I hear you.
Existing-Home Sales Fall for 12th Consecutive Month; Lowest Since 2010
This article was originally written by Doug Short. From 2016-2022, it was improved upon and updated by Jill Mislinski. Starting in January 2023, AP Charts pages will be maintained by Jennifer Nash at Advisor Perspectives/VettaFi.
This morning's release of the January existing home sales showed that sales fell slightly to a seasonally adjusted annual rate of 4.00 million units from the previous month's 4.03 million. This is the lowest level of sales since October 2010 and is worse than the Investing.com forecast of 4.10 million. The latest number represents a 0.7% decrease from the previous month and its twelfth monthly decline in a row. January saw a 36.9% decrease YoY.
Here is an excerpt from today's report from the National Association of Realtors.
Over this time frame, we clearly see the real estate bubble, which peaked in 2005 and then fell dramatically. Sales were volatile for the first year or so following the great recession.
This article was originally written by Doug Short. From 2016-2022, it was improved upon and updated by Jill Mislinski. Starting in January 2023, AP Charts pages will be maintained by Jennifer Nash at Advisor Perspectives/VettaFi.
This morning's release of the January existing home sales showed that sales fell slightly to a seasonally adjusted annual rate of 4.00 million units from the previous month's 4.03 million. This is the lowest level of sales since October 2010 and is worse than the Investing.com forecast of 4.10 million. The latest number represents a 0.7% decrease from the previous month and its twelfth monthly decline in a row. January saw a 36.9% decrease YoY.
Here is an excerpt from today's report from the National Association of Realtors.
In terms of median home sales prices among all homes, here's the latest:WASHINGTON (February 21, 2023) – Existing-home sales fell for the twelfth straight month in January, according to the National Association of Realtors®. Month-over-month sales were mixed among the four major U.S. regions, as the South and West registered increases, while the East and Midwest experienced declines. All regions recorded year-over-year declines.
Total existing-home sales,1 https://www.nar.realtor/existing-home-sales – completed transactions that include single-family homes, townhomes, condominiums and co-ops – slid 0.7% from December 2022 to a seasonally adjusted annual rate of 4.00 million in January. Year-over-year, sales retreated 36.9% (down from 6.34 million in January 2022).
“Home sales are bottoming out,” said NAR Chief Economist Lawrence Yun. “Prices vary depending on a market’s affordability, with lower-priced regions witnessing modest growth and more expensive regions experiencing declines.” [Full Report]
For a longer-term perspective, here is a snapshot of the data series, which comes from the National Association of Realtors. The data since January 1999 was previously available in the St. Louis Fed's FRED repository and is now only available for the last twelve months.The median existing-home price3 for all housing types in January was $359,000, an increase of 1.3% from January 2022 ($354,300), as prices climbed in three out of four U.S. regions while falling in the West. This marks 131 consecutive months of year-over-year increases, the longest-running streak on record.
Over this time frame, we clearly see the real estate bubble, which peaked in 2005 and then fell dramatically. Sales were volatile for the first year or so following the great recession.
Im a bit worried about markets expectations on fed funds rate. Fed has to defend credibility. They need to create demand destruction, and watch it happen. That means higher terminal, and higher for longer. Markets just now repricing for this. Equites looking a bit ugly. I worry we may have a risk off wave in equities/corp bonds etc in spring, as the canary is warning in the coal mine: credit spreads widening, vix rising, cycle traders seeing a rocky march/April/May, fed terminal rate moving higher out farther on curve, yields rising.
jeffrey lynch
New member
Im a bit worried about markets expectations on fed funds rate. Fed has to defend credibility. They need to create demand destruction, and watch it happen. That means higher terminal, and higher for longer. Markets just now repricing for this. Equites looking a bit ugly. I worry we may have a risk off wave in equities/corp bonds etc in spring, as the canary is warning in the coal mine: credit spreads widening, vix rising, cycle traders seeing a rocky march/April/May, fed terminal rate moving higher out farther on curve, yields rising.
yep - Milk Wilson, one of the most accurate equity strategists on Wall Street, is convinced that the S&P will ultimately take out its October low and descend somewhere between 3000 and 3300 before inevitably bouncing a bit off the new low. How this will play out will be interesting.
I think the Fed has a credibility problem because of caving to tantrums in the past. Wall Street just doesn't believe JPow won't chicken out again. And who can blame them given history?
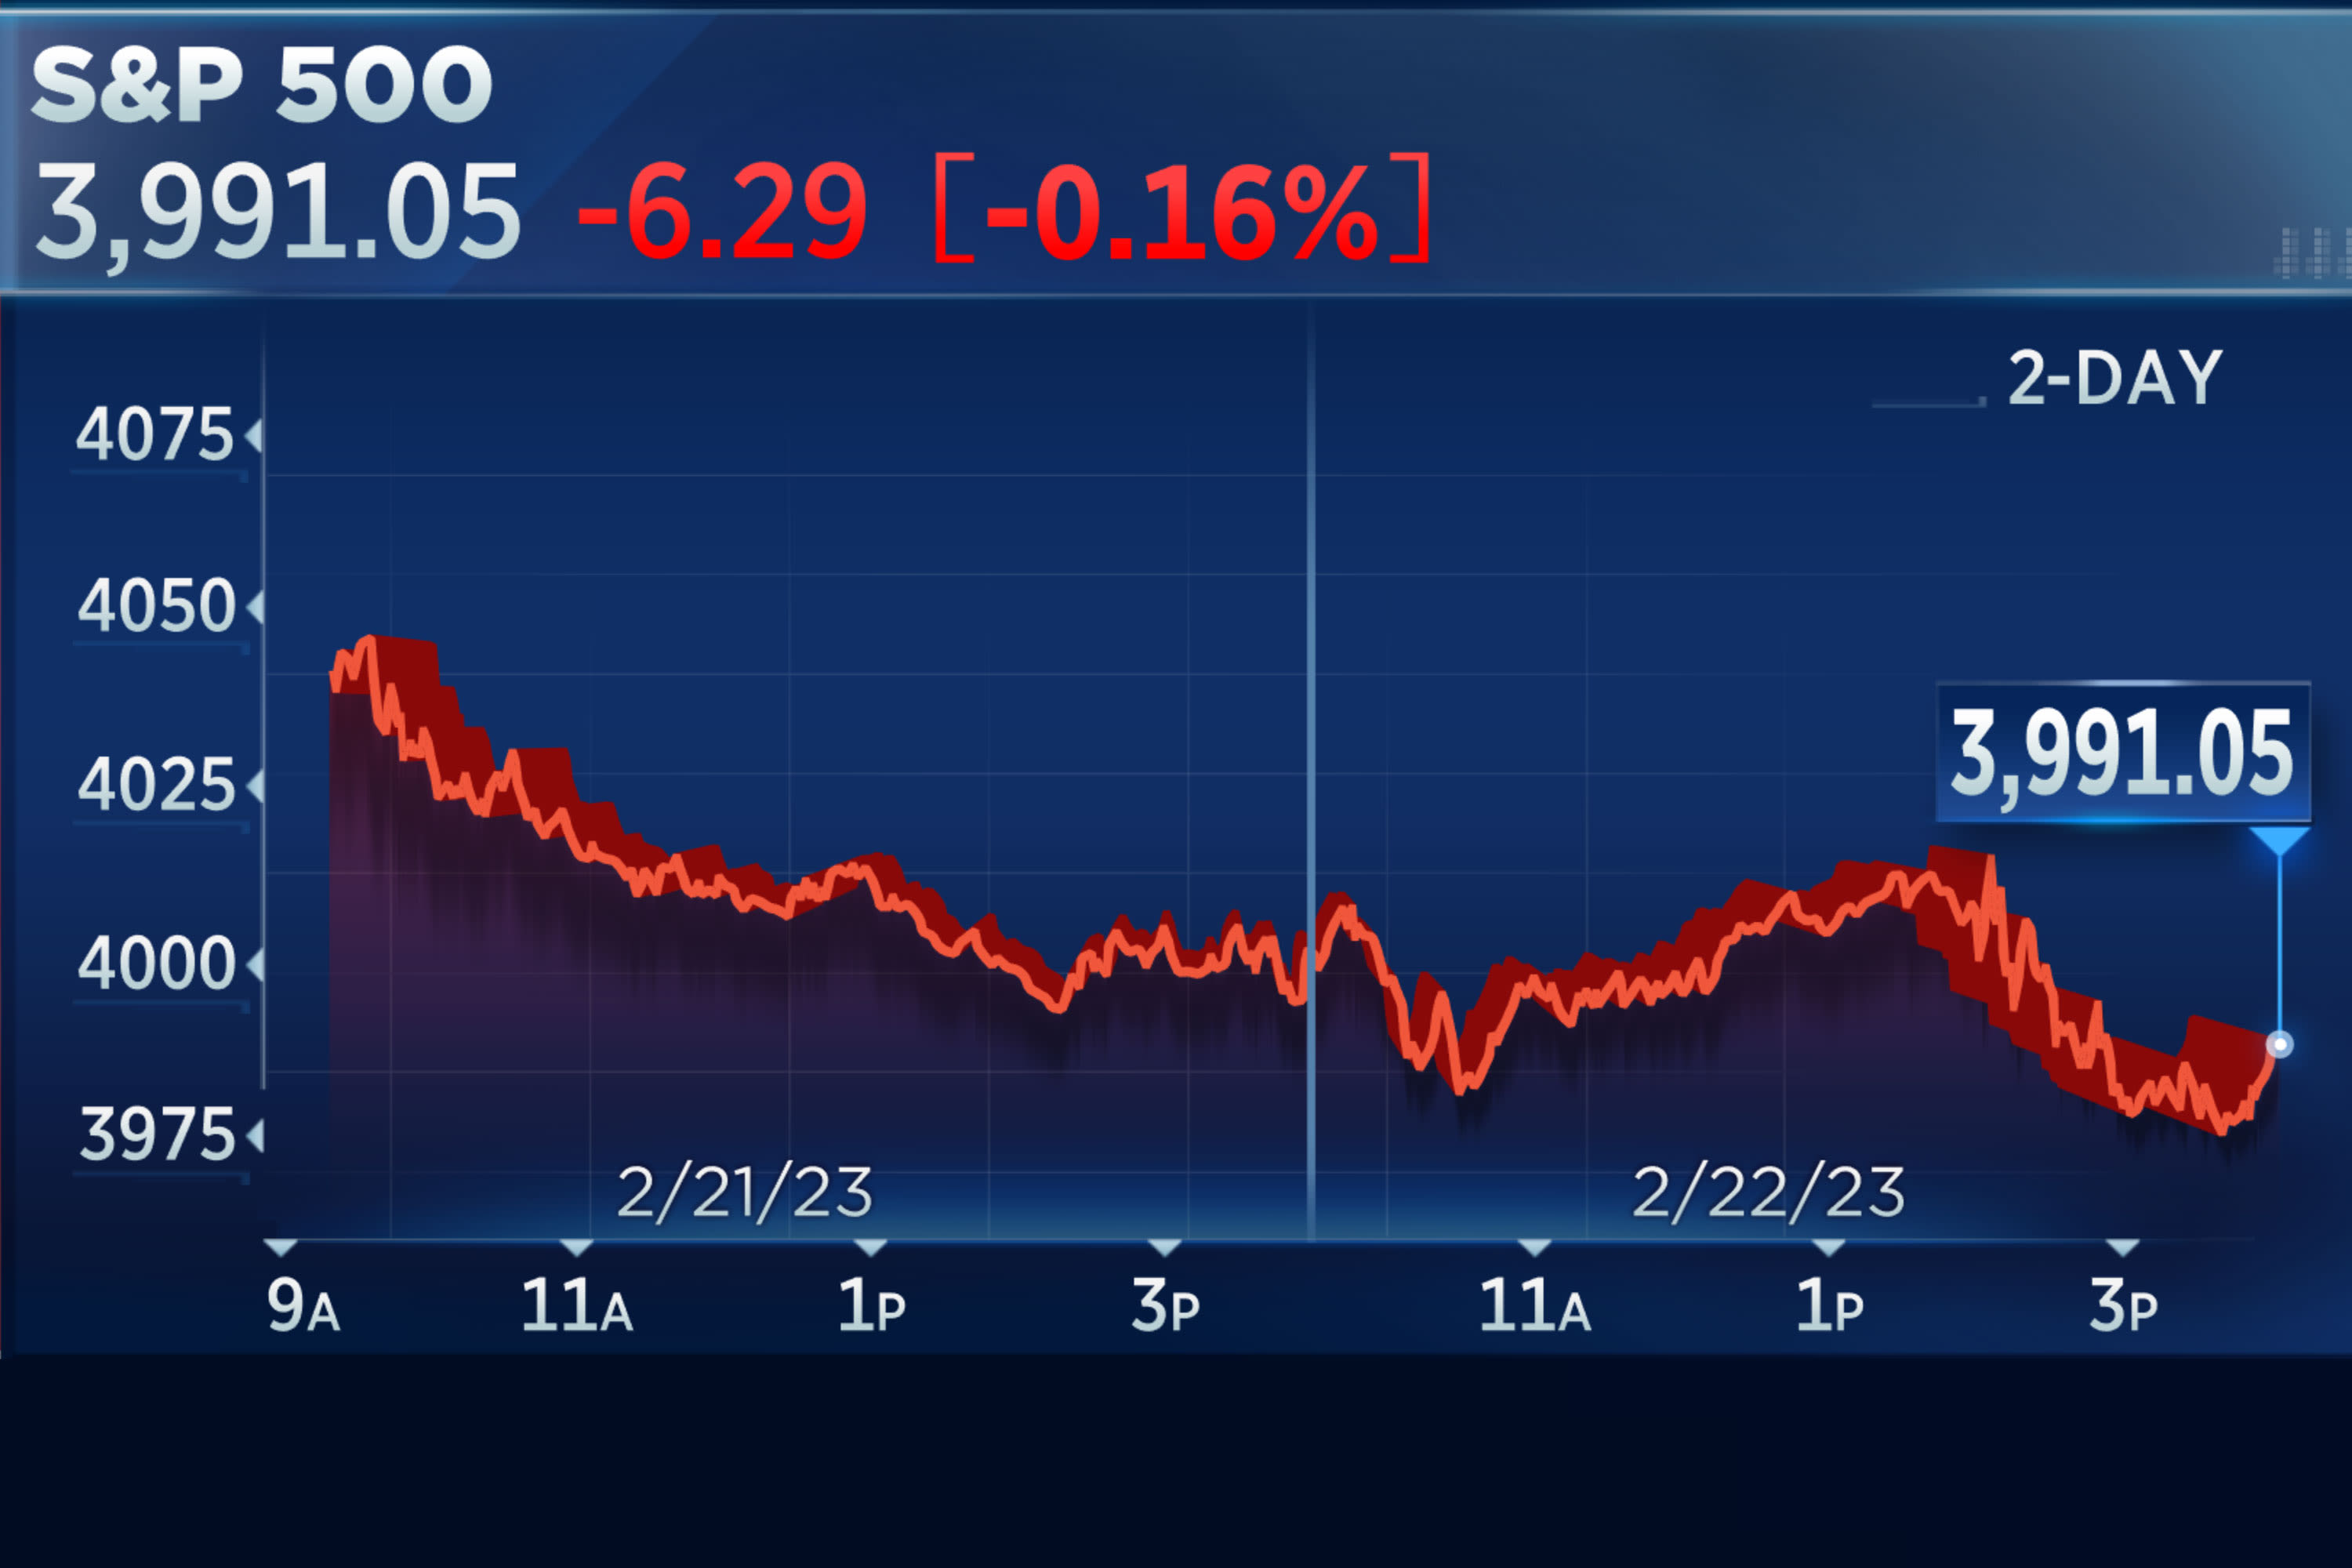
 www.cnbc.com
S&P 500 notches fourth day of losses after Fed minutes reaffirm tough stance on inflation: Live updates
The S&P 500 slipped after the Federal Reserve released its minutes from its latest meeting, in which the central bank reaffirmed its fight against inflation.
www.cnbc.com
S&P 500 notches fourth day of losses after Fed minutes reaffirm tough stance on inflation
yep, saw that around fintwit. Gonna be wild next few quarters, keep dry powder readyyep - Milk Wilson, one of the most accurate equity strategists on Wall Street, is convinced that the S&P will ultimately take out its October low and descend somewhere between 3000 and 3300 before inevitably bouncing a bit off the new low. How this will play out will be interesting.
") )
)equities always seem to be missing the forest for the treesI think the Fed has a credibility problem because of caving to tantrums in the past. Wall Street just doesn't believe JPow won't chicken out again. And who can blame them given history?
S&P 500 notches fourth day of losses after Fed minutes reaffirm tough stance on inflation: Live updates
The S&P 500 slipped after the Federal Reserve released its minutes from its latest meeting, in which the central bank reaffirmed its fight against inflation.S&P 500 notches fourth day of losses after Fed minutes reaffirm tough stance on inflation

Crunching the Numbers: 2023 NY Real Estate Market Predictions
Crunching the Numbers: 2023 NY Real Estate... - New York City, NY - HGAR and OneKey® MLS hosted a panel of experts in a discussion on how the NY market is shaping up so far this year and where its headed.
 patch.com
Crunching the Numbers: 2023 NY Real Estate Market Predictions
HGAR and OneKey® MLS hosted a panel of experts in a discussion on how the NY market is shaping up so far this year and where it’s headed.
By M Lauricella, Community Contributor
The Hudson Gateway Association of Realtors, Inc. (HGAR) and OneKey® MLS hosted a virtual panel last week featuring real estate experts who discussed how the New York market is shaping up so far this year and where it’s headed. Leaders from First Republic Bank, Marketproof, Inc. and Miller Samuel Inc. walked through what the data tells us about the interest rate environment and the current state of the region’s unique market dynamics.
“We saw a trend last year where the market started out really strong and then started to decelerate in the third and fourth quarter. Right now, we’re seeing the product of that deceleration, and will start to see a lot of activity for the spring market because buyers have been on the sidelines waiting to see what would happen. But now that we’re beginning to have stability in interest rates and pricing, things are going to get going again,” said Richard Haggerty, CEO of OneKey® MLS, the regional multiple listing service that covers nearly a dozen counties in the greater NYC area from Manhattan, to Suffolk, Westchester and Sullivan counties.
Subscribe
“Crunching the Numbers: Buy, Hold or Sell?” featured Marissa S. Tracey, managing director, relationship management at First Republic Bank; Kael Goodman, president and CEO at Marketproof; and Jonathan Miller, president and CEO at Miller Samuel Inc. The event was moderated by Brian D. Tormey, NTP, president of TitleVest, a leading NYC-based provider of title insurance and related real estate services.
Tracey started off with a summary of the interest rate environment and predictions for what will happen next, which includes two more rate increases with a terminal rate of 5% by the end of May.
“Inventory is chronically low, with Westchester’s being the lowest on record, and we’re seeing this across every housing market,” said Miller. “2023 will be ‘the year of disappointment’ because sellers won’t get buyers at 2021 and early 2022 prices, and buyers aren’t going to see any massive improvement in inventory, affordability, or in rates any time soon – on the bright side this is a sign the economy is strong.”
The discussion soon turned to affordable housing and Goodman shared his perspective on steps to a solution.
“The issue related to housing in NYC has got to be solved in city hall and the governor’s office. The next phase is about government stimulus,” said Goodman. “The governor has proposed elongating the period to build under the 421-a tax exemption, but there are various zoning issues, and the cost of capital looks like it will remain an issue still for a while, so it’s going to require local leadership. The good news is, we do have a governor and a mayor who will talk to each other. We have a very complicated thing going on, and we don’t have enough perspective yet to figure it out.”
For more, view the webinar:

The webinar is part of the “Be Your Best” series created by HGAR and OneKey® MLS, to help Realtors and agents navigate a changing landscape. The event was sponsored by TitleVest.
About OneKey® MLS
OneKey® MLS has 50,000-plus subscribers and serves Manhattan, Westchester, Putnam, Rockland, Sullivan, Orange, Nassau, Suffolk, Queens, Brooklyn, and the Bronx. It was formed in 2018 by the Hudson Gateway Association of Realtors and the Long Island Board of Realtors.
About Hudson Gateway Association of Realtors®
The Hudson Gateway Association of Realtors (www.hgar.com) is a not-for-profit trade association representing more than 14,000 real estate professionals in Manhattan, the Bronx, Westchester, Putnam, Rockland and Orange counties. It is the second-largest Realtor association in New York, and one of the largest in the U.S.
Matt Bezci
New member
Crunching the Numbers: 2023 NY Real Estate Market Predictions
Crunching the Numbers: 2023 NY Real Estate... - New York City, NY - HGAR and OneKey® MLS hosted a panel of experts in a discussion on how the NY market is shaping up so far this year and where its headed.
Crunching the Numbers: 2023 NY Real Estate Market Predictions
HGAR and OneKey® MLS hosted a panel of experts in a discussion on how the NY market is shaping up so far this year and where it’s headed.
By M Lauricella, Community Contributor
The Hudson Gateway Association of Realtors, Inc. (HGAR) and OneKey® MLS hosted a virtual panel last week featuring real estate experts who discussed how the New York market is shaping up so far this year and where it’s headed. Leaders from First Republic Bank, Marketproof, Inc. and Miller Samuel Inc. walked through what the data tells us about the interest rate environment and the current state of the region’s unique market dynamics.
“We saw a trend last year where the market started out really strong and then started to decelerate in the third and fourth quarter. Right now, we’re seeing the product of that deceleration, and will start to see a lot of activity for the spring market because buyers have been on the sidelines waiting to see what would happen. But now that we’re beginning to have stability in interest rates and pricing, things are going to get going again,” said Richard Haggerty, CEO of OneKey® MLS, the regional multiple listing service that covers nearly a dozen counties in the greater NYC area from Manhattan, to Suffolk, Westchester and Sullivan counties.
Subscribe
“Crunching the Numbers: Buy, Hold or Sell?” featured Marissa S. Tracey, managing director, relationship management at First Republic Bank; Kael Goodman, president and CEO at Marketproof; and Jonathan Miller, president and CEO at Miller Samuel Inc. The event was moderated by Brian D. Tormey, NTP, president of TitleVest, a leading NYC-based provider of title insurance and related real estate services.
Tracey started off with a summary of the interest rate environment and predictions for what will happen next, which includes two more rate increases with a terminal rate of 5% by the end of May.
“Inventory is chronically low, with Westchester’s being the lowest on record, and we’re seeing this across every housing market,” said Miller. “2023 will be ‘the year of disappointment’ because sellers won’t get buyers at 2021 and early 2022 prices, and buyers aren’t going to see any massive improvement in inventory, affordability, or in rates any time soon – on the bright side this is a sign the economy is strong.”
The discussion soon turned to affordable housing and Goodman shared his perspective on steps to a solution.
“The issue related to housing in NYC has got to be solved in city hall and the governor’s office. The next phase is about government stimulus,” said Goodman. “The governor has proposed elongating the period to build under the 421-a tax exemption, but there are various zoning issues, and the cost of capital looks like it will remain an issue still for a while, so it’s going to require local leadership. The good news is, we do have a governor and a mayor who will talk to each other. We have a very complicated thing going on, and we don’t have enough perspective yet to figure it out.”
For more, view the webinar:
The webinar is part of the “Be Your Best” series created by HGAR and OneKey® MLS, to help Realtors and agents navigate a changing landscape. The event was sponsored by TitleVest.
About OneKey® MLS
OneKey® MLS has 50,000-plus subscribers and serves Manhattan, Westchester, Putnam, Rockland, Sullivan, Orange, Nassau, Suffolk, Queens, Brooklyn, and the Bronx. It was formed in 2018 by the Hudson Gateway Association of Realtors and the Long Island Board of Realtors.
About Hudson Gateway Association of Realtors®
The Hudson Gateway Association of Realtors (www.hgar.com) is a not-for-profit trade association representing more than 14,000 real estate professionals in Manhattan, the Bronx, Westchester, Putnam, Rockland and Orange counties. It is the second-largest Realtor association in New York, and one of the largest in the U.S.
Thank you for sharing this!
Housing Bust #2 Has Begun
by Wolf Richter • Mar 4, 2023 • 362 Comments
Some markets are already deep into it, others just started. A sobering trip from the free-money decade in la-la-land, back to normal.
By Wolf Richter. This is the transcript of my podcast on Sunday, February 26, THE WOLF STREET REPORT.
The housing market in the United States has turned down, and in some big markets very dramatically so. Other markets lag a little behind.
That’s how it went during the last Housing Bust, that I now call Housing Bust #1. During Housing Bust #1, Miami, Phoenix, San Diego, Las Vegas, etc. were a little ahead; other places, like San Francisco were a little behind. In 2007, people in San Francisco thought they would be spared the housing bust they saw unfolding across the country. And then it came to San Francisco with a vengeance.
This time around, San Francisco and Silicon Valley, and the entire San Francisco Bay Area, are at the forefront, along with Boise, Seattle, and some others. In the San Francisco Bay Area, during the first 10 months of this housing bust, Housing Bust #2, the median house price has plunged faster than it did during the first 10 months of Housing Bust #1. That’s what we’re looking at. I’ll get into the details in a moment.
Across the US, home sales have plunged month after month ever since mortgage rates started to rise a year ago. In January, across the US, total home sales plunged by 37% from January last year. Sales plunged in all regions, but they plunged worst in the West, by 42% year-over-year, and the least worst, if I may, in the Midwest, by 33%. This is happening everywhere.
The median price of all types of homes across the US in January fell for the seventh month in a row, down over 13% from the peak in June. Some of the decline is seasonal, and some is not.
This drop whittled down the year-over-year gain to just 1.3%. At this pace, we will see a year-over-year price decline in February or March, which would be the first year-over-year price decline across the US since Housing Bust 1.
Active listings were up by nearly 70% from a year ago, though by historical standards they’re still low. Lots of sellers are sitting on their vacant properties and are holding them off the market, and are putting them on the rental market or are trying to make a go of it as vacation rentals. And they’re all hoping that “this too shall pass.”
“This too shall pass” – that’s the mortgage rates. The average 30-year fixed mortgage rate went over 7% late last year, then in January, it dropped, went as low as 6%, and the entire industry was breathing a sigh of relief. This was based on fervent hopes that inflation would just vanish, and that the Federal Reserve would cut interest rates soon, and be done with this whole nightmare.
But in early February came the realization that inflation wasn’t just going away. Friday’s inflation data confirmed that inflation is reaccelerating, that it already started the process of reacceleration in December. Some goods prices are down, but inflation in services spiked to a four-decade high. Services is nearly two-thirds of what consumers spend their money on. Inflation is very difficult to dislodge from services. The Federal Reserve is going to have its hands full dealing with this – meaning higher rates for longer.
And mortgage rates jumped again and on Friday were back to about 6.9%, according to the daily measure by Mortgage News Daily. Just a hair below the magic 7%.
And potential sellers are still sitting on their vacant properties, thinking: and this too shall pass.
So how many vacant homes are there? The Census Bureau tracks this. In the fourth quarter last year, there were nearly 15 million vacant housing units – so single-family houses, condos, and rental apartments. That’s over 10% of the total housing stock.
In 2022, the number of total housing units increased by over 1.3 million. If each housing unit is occupied on average by 2.5 people, that’s housing for 3.3 million more people than in the prior year. The US population hasn’t grown nearly that fast in 2022.
Ok, so now here are nearly 15 million vacant housing units. Of them, 11 million were vacant year-round. Some of the 11 million were being remodeled to be rented out, and others were for sale, and that’s the inventory we actually see, and there are other reasons why homes were vacant.
But 6.6 million homes were held off the market, for a variety of reasons, such as that the owners don’t want to sell the property at the moment.
If just 10% of these 6.6 million homes that are held off the market show up on the market, it would double the total number of active listings. If 20% of these homes show up on the market, it would trigger an enormous glut.
This is the shadow inventory. It can emerge at any time. And during Housing Bust 1, this shadow inventory that suddenly emerged created the biggest housing glut ever.
Since the San Francisco Bay Area is ahead of the game, let’s look at it more closely. It’s a market with a population of just under 8 million people. The median price of single-family houses in January plunged by 35% from the crazy peak in April last year. Year-over-year, from January to January, the median price has plunged 17%. This is according to the California Association of Realtors.
In dollar terms, the median price plunged by over half a million bucks from the peak. That’s a lot of money to go up in smoke.
Well, it’s not really money that went up in smoke, it’s the illusion of money that went up in smoke.
Prices had spiked so fast during the free-money era of the pandemic that this massive plunge didn’t even take the price back to January 2020.
Not that many people bought a house during these three years, and fewer still bought a house near the peak. So the plunge in prices didn’t actually impact a lot of homeowners – just those who bought after mid-2020. That’s a relatively small number. The homeowners who bought in 2019 and before, that’s the vast majority of homeowners – they are still above water, and many of them are still sitting on a lot of equity.
But this thing is moving fast now.
During Housing Bust 1, over a two-year period, the median price in the San Francisco Bay Area plunged by 58%. Now, we’re 10 months into housing bust 2.
So over the first ten months of Housing Bust 1 back in 2008, the median price plunged by 21%.
Over the first ten month of Housing Bust 2, in 2022 and 2023, the median price plunged by 35%.
In other words, the median price is now falling faster than it did in 2008.
Granted, median prices are not the most reliable measure. They’re very volatile and they’re seasonal. And they can get skewed by a change in the mix. For example, if the rich pull their homes off the market because they can afford to hang on to them, and only mid- to lower-end homes are sold, then there are fewer high-end homes in the sales mix, which pushes down the median price. This happened during Housing Bust 1, and was a factor in the 58% plunge in the media price.
There are other markets that have home price declines that are similar to those in the Bay Area, including Boise and Seattle. But other markets just started turning down.
In the Bay Area, home sales – so the number of sales that closed – collapsed by 37% year-over-year, which is just above the national average of 34%. This is the sign of a frozen market.
Active listings have jumped in the Bay Area, and days on the market have nearly tripled from a year ago, to 32 days.
Pulling the home off the market is now a common practice. What lots of sellers are now doing is that they list the home at some aspirational price, and no one shows up. A month later, they pull it off the market. A month later, they list it on the rental market to see if they can get someone to fork over enough in rent to cover the mortgage payment. And that obviously doesn’t work. So then a month later, they pull it off the rental market. And then another month later, they relist it for sale at a lower price. Others are trying to make a go of it as a vacation rental, but there are tons of vacation rentals all over the place, and it’s hard to make that work.
If sellers cut the price enough, eventually the home will sell. If the price is right, anything will sell. The clearing price is reality. The hard part is for the seller to accept the clearing price, if they can actually afford to sell at the clearing price.
Some sellers put the home on the market priced right from the beginning, and they make a deal quickly.
For sellers, this is not the time to dilly-dally around. If they do dilly-dally around, they’re just going to chase prices lower. Those who panic first, panic best.
It’s not like there is no market out there, and no buyers. There is a market and there are buyers, but the market and the buyers are just a lot lower than where they used to be.
So why is all this happening so fast?
It’s not the economy. People are working, their pay has gone up by the most in four decades. Unemployment is still near historic lows. Actual layoffs and involuntary discharges – meaning people getting fired – are near historic lows.
Even during the Good Times, there are on average 1.8 million layoffs and discharges every month, and that’s part of the normal churn in the huge labor market. Every month for the past two years, including late last year with all the layoff announcements hailing down, the total actual layoffs and discharges were below the Good Times lows before the pandemic, they were at 1.5 million a month or below, the lowest in the data going back over two decades.
Unemployment goes up when there are more of these layoffs, while companies stop hiring, and those that got fired or laid off suddenly can’t get a job any more. And that’s just not happening yet.
Companies have hyped these layoff announcements for months. Usually their stock price jumps when they do. But they’re just announcements, not actual layoffs, and they’re by global companies for their global staff, and many of those layoffs take place in other countries.
Actual layoffs are easy to check in California because companies with more than 75 employees have to report them under the Worker Adjustment and Retraining Notification Act.
San Francisco was the worst off with layoffs, in terms of the size of the labor market. But it only had 7,000 total layoffs since July, despite all the hoopla about the 5,000 layoffs at Twitter alone, and the tens of thousands of layoffs at a bunch of other companies that are either headquartered in San Francisco or have big offices in San Francisco.
And that was as bad as it gets in California. But other companies are hiring, and in California overall, employment has still increased. And the unemployment rate is still historically low.
In other words, there just isn’t a surge in unemployment. The labor market remains tight. People are working and they’re getting big pay raises, and many of those that got laid off are finding new jobs quickly. And that should be great for the housing market.
But this housing market didn’t get tripped up by a surge in unemployment, not even in the Bay Area. Unemployment is a shoe that might drop on this housing market in the future.
What tripped up the housing market so far is the toxic mix of several factors, including:
A surge in mortgage rates
Home prices that had exploded into the stratosphere.
And the sharp drop in stocks, especially the implosion of the IPO and SPAC bubbles, and the plunge in crypto prices have sapped the exuberance, and lots of people lost lots of money.
Home prices had exploded into the stratosphere because of the Federal Reserve’s monetary policies – and nothing else – because of the nearly $5 trillion it printed between March 2020 and March 2022, to repress long-term interest rates, including mortgage rates, and to create the biggest asset price bubble ever.
But now all this is over, now we have raging inflation, the Fed hiked rates, and will hike them further, they will go over 5%, and the Fed is pursuing Quantitative Tightening, and by the end of February, it cut its balance sheet by over $600 billion.
So the Fed is hiking rates and unwinding its balance sheet, and asset prices have come down, including stocks and bonds and cryptos, and housing.
What we’re seeing is the unwinding of the biggest asset bubble ever – including home prices. And so far, this has nothing to do with unemployment or the overall economy. Jobs are plentiful, wages are up, consumers are spending, companies are spending and investing, governments are spending like there’s no tomorrow.
This could change: Unemployment might surge, and job openings could vanish, and consumers who lost their jobs could cut back on spending, and state and local governments that are still swimming in pandemic money, will run out of this pandemic money and then they will have to cut spending. All this is the other shoe that could still drop on the housing market.
But it hasn’t dropped on the housing market yet. The decline in the housing market so far has been driven entirely by the rapid disappearance of free money that everyone had gotten used to since 2008. Housing Bust #2 may turn out to be a sobering trip from the free-money decade in la-la-land, back to normal.

Manhattan, Brooklyn Markets May See Spring Thaw
February contract activity was up, but inventory remained tight in Manhattan and Brooklyn, per Miller Samuel for Douglas Elliman.
therealdeal.com
Manhattan, Brooklyn markets could see spring thaw
Listings and activity tick up after streak of decline")
MAR 2, 2023, 7:00 AM
By
Could Manhattan and Brooklyn housing markets be in store for a spring thaw?
That’s what new signed contracts and new listings data collected last month by appraisal firm Miller Samuel on behalf of Douglas Elliman suggest, though the report’s author was quick to say it’s unclear if the trend will continue.
“Part of that activity can be attributable to the previous drop in rates before the Fed did their last increase,” said Miller Samuel CEO Jonathan Miller, referring to the central bank’s quarter-point rate increase announced in early February.
“I’m not sure if in March we’ll see the same growth,” Miller said. “I wouldn’t be surprised, but it’s not quite a trend yet.”
Manhattan’s market saw increases that Miller called “beyond seasonal.” The boosts came in listings across the co-op and one-to-three family building markets, along with new signed contracts increasing in the co-op and condo markets.
But there are signs of tightness. There was a slight decline in new condo listings and new contracts fell for the second straight month in the one-to-three family market.
New signed contracts are up 4.6 percent and new listings are down 29.1 percent from February 2020, the last comparable period before the pandemic.Brooklyn has seen a surge in activity in the last four months compared to pre-pandemic levels. Contract activity remained more than 30 percent above pre-pandemic levels in that period and in February was 52.5 percent higher. That’s despite new listings being down more than 8 percent from pre-pandemic levels.
In line with that trend, inventory fell month-over-month in Brooklyn’s condo and co-op markets while listings and contracts rose in the one-to-three family market.
The two factors keep prices from dropping as much as buyers might hope, Miller said.
“This is the year of disappointment,” said Miller, citing his oft-used mantra for 2023. “Sellers aren’t going to get their price of 2021 and buyers aren’t going to see significant cost savings.”