“Exodus” Havoc: Rents Plunge in San Francisco, New York, Boston, Seattle, Other High-Cost Cities, but Soar 50% in Newark in 18 Months, with Double-Digit Jumps in 20 Cities
by Wolf Richter • Jan 4, 2021 • 136 Comments
OK, it’s getting a little crazy: Massive shifts due to working from anywhere and the Pandemic. But some of those shifts started well before the Pandemic.
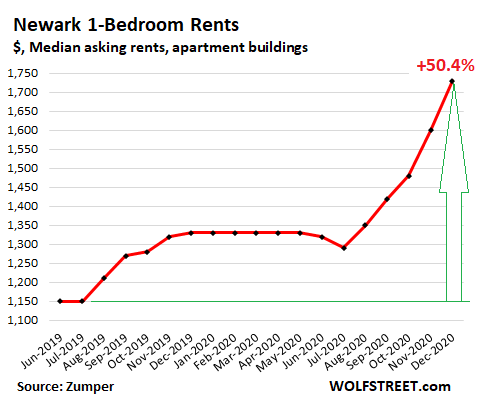
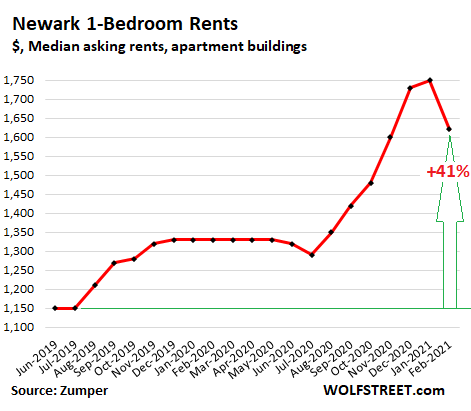
In the exodus cities, rents continued plunging in December. For example, in San Francisco, the median asking rent for one-bedroom apartments fell 1.5% from November and is now down 28% from June 2019; in New York City and in Seattle, rents fell about 2.5% for the month and are down 21% from July 2019. But in Newark, where some New York apartment dwellers that are working from anywhere have fled to, rents have skyrocketed by 50% since July 2019. Newark?!?
Yup, in Newark, the median asking rent for one-bedroom apartments in December jumped by 8.1% from November, and is up by 30% from a year ago, and by 50% from June 2019. This surge in rents has catapulted Newark into the rarefied air of the 9th most expensive major rental market in the US, up from 40th place in June 2019 (more in a moment on those expensive rental markets that are dominated by big double-digit decliners):
Rents are depicting the massive shifts playing out in the US housing market, brought about by the Pandemic and by working from anywhere and perhaps by a general urge to rethink things.
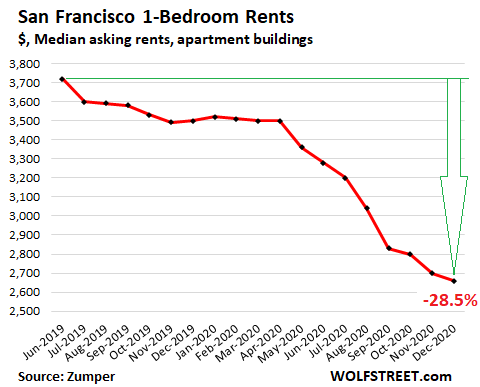
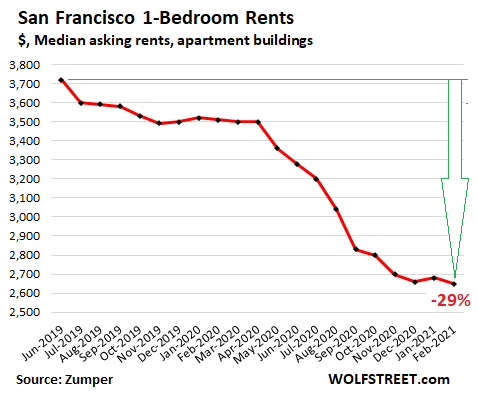
San Francisco rents in breath-taking downward spiral.
San Francisco remains the most expensive rental market in the US only because rents are also plunging in New York City. The median asking rent in December for 1-BR apartments dropped another 1.5% from November, and by 24% year-over-year, and by 28.5% from June 2019, to $2,660, according to data from
Zumper’s Rent Report. In terms of dollars, the drop since June 2019 amounted to $1,060 a month.
This does not include the widely advertised incentives of “two months free,” or getting popular, “three months free,” which cut effective rents for the first year by an additional slice:
For 2-BR apartments in San Francisco, the median asking rent dropped by 2.0% in December from November, and by 22% year-over-year, to $3,500. Since June 2019, it has plunged by 27%, or by $1,300 a month, not including the incentives.
These are median asking rents in apartment buildings, including apartment towers. There are now reports of
vacancy rates of 30% in luxury apartment towers in San Francisco, with landlords advertising “three months free.”
“Asking rent” is the advertised rent of a rental apartment, but does not include concessions, such as two months free. “Median” asking rent is the middle asking rent, with half of the asking rents higher and half lower.
Zumper collects this data from the Multiple Listings Service (MLS) and other listings, including its own listings, in the 100 largest markets of the US. These are rentals in apartment buildings, including new construction, but do not include single-family houses for rent and condos for rent.
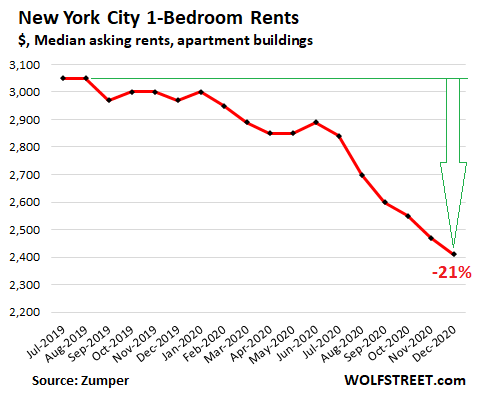
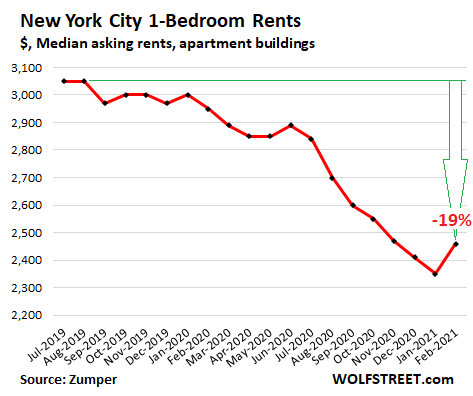
New York City rents plunged.
The median asking rent for 1-BR apartments in New York City in December fell by 2.4% from November, and by 19.7% year-over-year, to $2,410, according to Zumper data. Since July 2019, the median 1-BR rent has plunged by 21%:
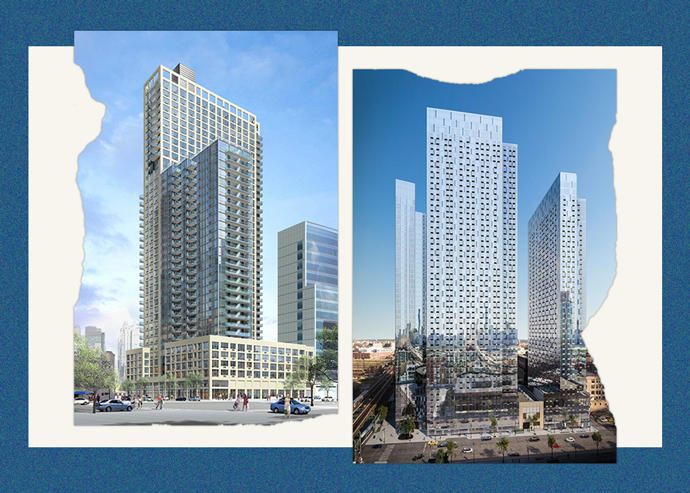
New York City’s 2-BR rents plunged 6.1% in December from November, by 22.4% year-over-year, and by 25% since October 2019, to $2,630. There are now reports of soaring vacancy rates even at the very high end, in iconic apartment towers in the center of Manhattan, such as the
“New York by Gehry” 76-story tower with nearly 900 apartments, where vacancy rates jumped to nearly 30%.
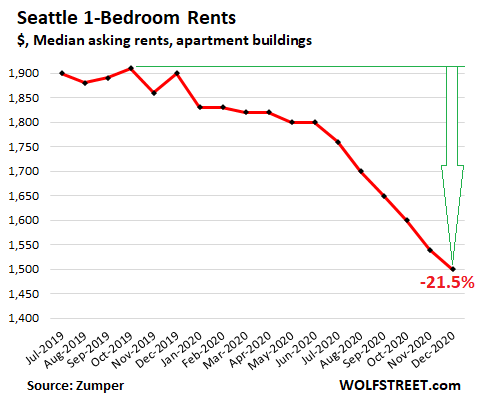
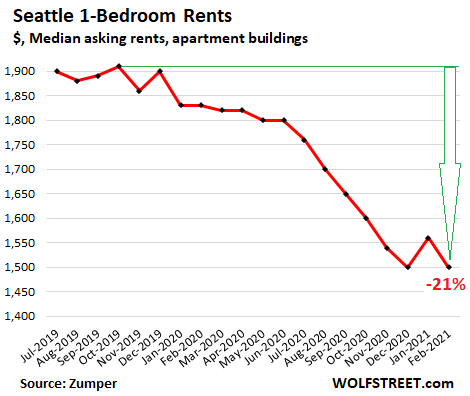
Seattle rents plunged.
In December, the median asking rent for 1-BR apartments in Seattle dropped by 2.6% from November, by 20.6% year-over-year, by 21.5% since October 2019, and by 25% since the peak in May 2018, to $1,500:
The charts above show that the trends in rents started in 2019, well before the Pandemic, but that the Pandemic lit a fire under those trends.
These are rents in apartment buildings, including apartment towers. They reflect the pressures on rents from two directions: The exodus from certain big cities with ridiculously high rents, which had started before the Pandemic, and the exodus from apartment towers given the virus transmission risks in potentially crowded environments, such as elevators. And that exodus has headed to apartments in cheaper areas, such as Newark, and to single-family houses, for sale and for rent, further afield, that no market was prepared for.
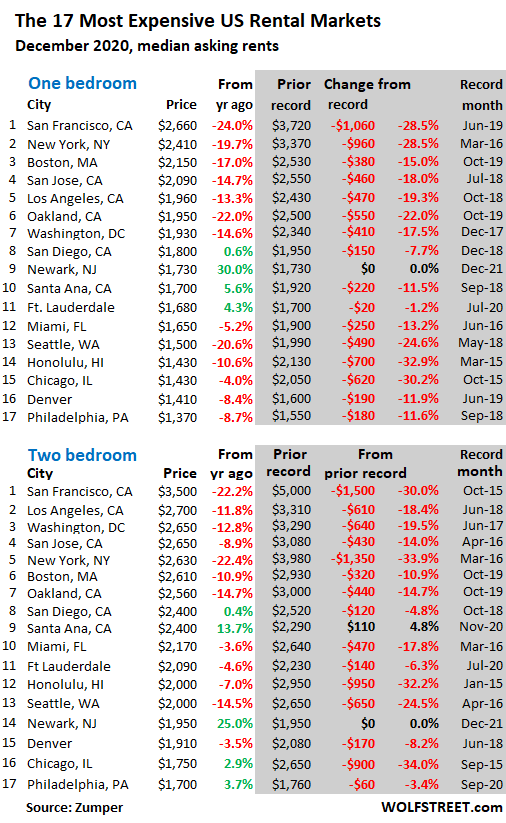
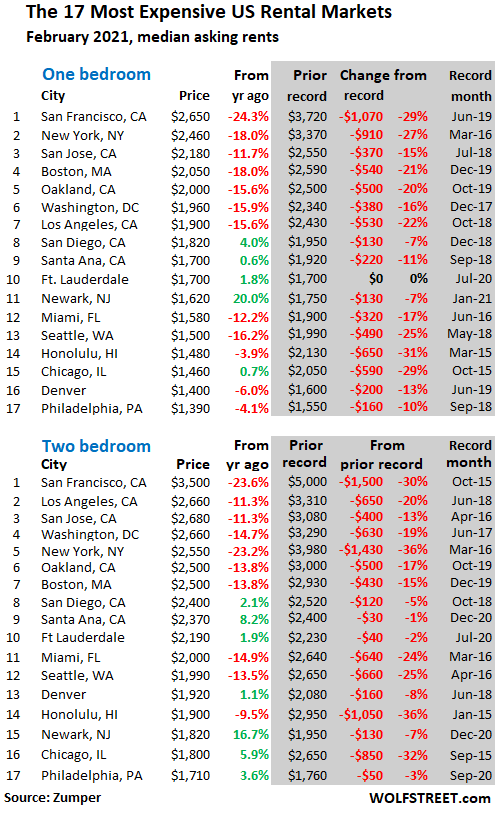
The 17 most expensive rental markets.
The new arrival in the table below of the most expensive major rental markets by median asking rents: Newark, NJ, with a year-over-year jump of 30% for 1-BR rents and a jump of 25% for 2-BR rents.
The shaded area shows peak rent and the changes from peak rent. The black entries in the shaded area indicate rent records set in December. Of the 17 markets, 14 booked double-digit drops in 1-BR rents from their respective peaks in prior years, with Honolulu topping out at -32.9%, followed by Chicago at -30.2%, and San Francisco at -28.5%!
The 24 cities with the Cheapest 1-BR rents:
These are the low-cost rental markets, where the median 1-BR asking rents range from $580 in Akron, OH, to $860 in Detroit. In some cities, rents are dropping, such as in Akron (-6.5% year-over-year). But in many cities at the cheap end, rents are rising, and in a few, rents are soaring, particularly in Tucson (+13.4%) and Detroit (+19.4%), whose downtown has been revitalizing for a decade:
| The 24 Cities with lowest 1-BR rents, $ & Y/Y% | | | |
| 1 | Akron, OH | $580 | -6.5% |
| 2 | Wichita, KS | $640 | -4.5% |
| 3 | Lubbock, TX | $650 | 0.0% |
| 4 | Shreveport, LA | $660 | 1.5% |
| 5 | Tulsa, OK | $660 | 3.1% |
| 6 | Laredo, TX | $690 | -2.8% |
| 7 | El Paso, TX | $700 | 4.5% |
| 8 | Lexington, KY | $740 | 1.4% |
| 9 | Oklahoma City, OK | $760 | 0.0% |
| 10 | Tucson, AZ | $760 | 13.4% |
| 11 | Albuquerque, NM | $780 | 11.4% |
| 12 | Lincoln, NE | $780 | -3.7% |
| 13 | Augusta, GA | $800 | 6.7% |
| 14 | Baton Rouge, LA | $800 | 5.3% |
| 15 | Greensboro, NC | $800 | 11.1% |
| 16 | Tallahassee, FL | $800 | -3.6% |
| 17 | Bakersfield, CA | $810 | 0.0% |
| 18 | Omaha, NE | $810 | 1.3% |
| 19 | Winston Salem, NC | $810 | 1.3% |
| 20 | Memphis, TN | $830 | 7.8% |
| 21 | Syracuse, NY | $830 | 2.5% |
| 22 | Columbus, OH | $850 | 6.3% |
| 23 | Knoxville, TN | $850 | 4.9% |
| 24 | Detroit, MI | $860 | 19.4% |
The 26 Cities where 1-BR rents dropped.
In December, the median asking rent for 1-BR apartments fell year-over-year in 26 of the largest rental markets. In 19 of them, rents fell by 5% or more. In 11 of them, rents fell by the double digits, all but one of them the usual suspects on the list of the 17 Most Expensive Rental Markets. But rents also dropped in some of the cheapest rental markets, such as Akron, OH; Tallahassee, FL; Wichita, KS; and Laredo, TX:
| The 26 Cities where 1-BR rents dropped YoY | | | |
| 1 | San Francisco, CA | $2,660 | -24.0% |
| 2 | Oakland, CA | $1,950 | -22.0% |
| 3 | Seattle, WA | $1,500 | -20.6% |
| 4 | New York, NY | $2,410 | -19.7% |
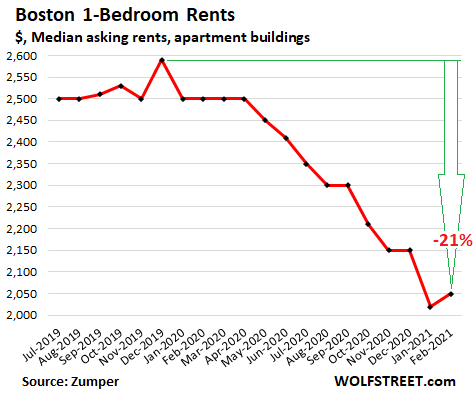
| 5 | Boston, MA | $2,150 | -17.0% |
| 6 | San Jose, CA | $2,090 | -14.7% |
| 7 | Washington, DC | $1,930 | -14.6% |
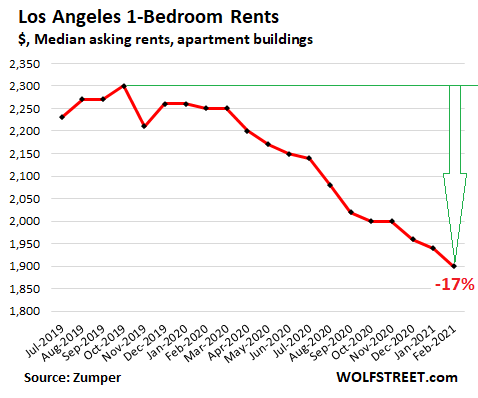
| 8 | Los Angeles, CA | $1,960 | -13.3% |
| 9 | Salt Lake City, UT | $1,000 | -13.0% |
| 10 | Pittsburgh, PA | $1,080 | -10.7% |
| 11 | Honolulu, HI | $1,430 | -10.6% |
| 12 | Nashville, TN | $1,250 | -9.4% |
| 13 | Buffalo, NY | $1,040 | -8.8% |
| 14 | Philadelphia, PA | $1,370 | -8.7% |
| 15 | Minneapolis, MN | $1,270 | -8.6% |
| 16 | Denver, CO | $1,410 | -8.4% |
| 17 | Akron, OH | $580 | -6.5% |
| 18 | Miami, FL | $1,650 | -5.2% |
| 19 | Madison, WI | $1,090 | -5.2% |
| 20 | Irving, TX | $1,040 | -4.6% |
| 21 | Wichita, KS | $640 | -4.5% |
| 22 | Chicago, IL | $1,430 | -4.0% |
| 23 | Lincoln, NE | $780 | -3.7% |
| 24 | Tallahassee, FL | $800 | -3.6% |
| 25 | Orlando, FL | $1,220 | -3.2% |
| 26 | Laredo, TX | $690 | -2.8% |
The 32 Cities where rents jumped between 6% and 30% YoY.
In December, the median 1-BR asking rent increased year-over-year in 68 of the 100 largest rental markets. In six markets, there was no change.
In 32 of these markets, rents jumped by 6% or more. In 19 of them, rents jumped between 10% and 30%, including five markets with year-over-year rent increases over 20%. Some of them, formerly among the cheapest markets, have been storming up the scale:
| The 32 Cities where 1-BR rents jumped 6%-30%, YoY | | | |
| 1 | Newark, NJ | $1,730 | 30.1% |
| 2 | St Petersburg, FL | $1,270 | 25.7% |
| 3 | Cleveland, OH | $1,180 | 25.5% |
| 4 | Indianapolis, IN | $1,000 | 22.0% |
| 5 | St Louis, MO | $1,000 | 22.0% |
| 6 | Detroit, MI | $860 | 19.4% |
| 7 | Virginia Beach, VA | $1,190 | 19.0% |
| 8 | Fresno, CA | $1,160 | 17.2% |
| 9 | Spokane, WA | $890 | 17.1% |
| 10 | Richmond, VA | $1,300 | 16.1% |
| 11 | Chattanooga, TN | $1,030 | 14.4% |
| 12 | Providence, RI | $1,530 | 14.2% |
| 13 | Tucson, AZ | $760 | 13.4% |
| 14 | Boise, ID | $1,130 | 13.0% |
| 15 | Henderson, NV | $1,270 | 11.4% |
| 16 | Albuquerque, NM | $780 | 11.4% |
| 17 | Greensboro, NC | $800 | 11.1% |
| 18 | Sacramento, CA | $1,430 | 10.9% |
| 19 | Norfolk, VA | $1,020 | 10.9% |
| 20 | Rochester, NY | $1,020 | 9.7% |
| 21 | Chandler, AZ | $1,320 | 9.1% |
| 22 | Las Vegas, NV | $1,030 | 8.4% |
| 23 | Mesa, AZ | $970 | 7.8% |
| 24 | Memphis, TN | $830 | 7.8% |
| 25 | Gilbert, AZ | $1,330 | 7.3% |
| 26 | Corpus Christi, TX | $880 | 7.3% |
| 27 | Colorado Springs, CO | $1,070 | 7.0% |
| 28 | Durham, NC | $1,090 | 6.9% |
| 29 | Jacksonville, FL | $960 | 6.7% |
| 30 | Augusta, GA | $800 | 6.7% |
| 31 | Columbus, OH | $850 | 6.3% |
| 32 | Louisville, KY | $880 | 6.0% |
The Largest 100 rental markets.
Below are the top 100 rental markets, with 1-BR and 2-BR median asking rents in December, and year-over-year percent changes, in order of 1-BR rents. You can search the list via the search function in your browser. If your smartphone clips the 6-column table on the right, hold your device in landscape position:
| Rents, Top 100 Cities | 1-BR $ | Y/Y % | 2-BR $ | Y/Y % | |
| 1 | San Francisco, CA | $2,660 | -24.0% | $3,500 | -22.2% |
| 2 | New York, NY | $2,410 | -19.7% | $2,630 | -22.4% |
| 3 | Boston, MA | $2,150 | -17.0% | $2,610 | -10.9% |
| 4 | San Jose, CA | $2,090 | -14.7% | $2,650 | -8.9% |
| 5 | Los Angeles, CA | $1,960 | -13.3% | $2,700 | -11.8% |
| 6 | Oakland, CA | $1,950 | -22.0% | $2,560 | -14.7% |
| 7 | Washington, DC | $1,930 | -14.6% | $2,650 | -12.8% |
| 8 | San Diego, CA | $1,800 | 0.6% | $2,400 | 0.4% |
| 9 | Newark, NJ | $1,730 | 30.1% | $1,950 | 25.0% |
| 10 | Santa Ana, CA | $1,700 | 5.6% | $2,400 | 13.7% |
| 11 | Fort Lauderdale, FL | $1,680 | 4.3% | $2,090 | -4.6% |
| 12 | Anaheim, CA | $1,660 | 1.2% | $1,990 | -1.0% |
| 13 | Miami, FL | $1,650 | -5.2% | $2,170 | -3.6% |
| 14 | Long Beach, CA | $1,600 | 0.0% | $2,090 | 4.5% |
| 15 | Providence, RI | $1,530 | 14.2% | $1,880 | 17.5% |
| 16 | Scottsdale, AZ | $1,520 | 2.0% | $2,020 | -3.8% |
| 17 | Seattle, WA | $1,500 | -20.6% | $2,000 | -14.5% |
| 18 | New Orleans, LA | $1,460 | 3.5% | $1,690 | 3.7% |
| 19 | Atlanta, GA | $1,430 | 0.7% | $1,870 | 4.5% |
| 20 | Chicago, IL | $1,430 | -4.0% | $1,750 | 2.9% |
| 21 | Sacramento, CA | $1,430 | 10.9% | $1,730 | 18.5% |
| 22 | Honolulu, HI | $1,430 | -10.6% | $2,000 | -7.0% |
| 23 | Denver, CO | $1,410 | -8.4% | $1,910 | -3.5% |
| 24 | Portland, OR | $1,400 | 2.9% | $1,770 | 4.1% |
| 25 | Philadelphia, PA | $1,370 | -8.7% | $1,700 | 3.7% |
| 26 | Gilbert, AZ | $1,330 | 7.3% | $1,580 | 9.0% |
| 27 | Chandler, AZ | $1,320 | 9.1% | $1,530 | 7.0% |
| 28 | Richmond, VA | $1,300 | 16.1% | $1,450 | 6.6% |
| 29 | Henderson, NV | $1,270 | 11.4% | $1,430 | 5.9% |
| 30 | Minneapolis, MN | $1,270 | -8.6% | $1,690 | -6.1% |
| 31 | St Petersburg, FL | $1,270 | 25.7% | $1,720 | 25.5% |
| 32 | Nashville, TN | $1,250 | -9.4% | $1,450 | 3.6% |
| 33 | Austin, TX | $1,230 | 0.0% | $1,520 | 0.0% |
| 34 | Orlando, FL | $1,220 | -3.2% | $1,400 | -2.1% |
| 35 | Dallas, TX | $1,210 | 4.3% | $1,640 | 3.1% |
| 36 | Baltimore, MD | $1,200 | 1.7% | $1,450 | 2.8% |
| 37 | Plano, TX | $1,200 | 0.8% | $1,550 | -3.1% |
| 38 | Charlotte, NC | $1,190 | 2.6% | $1,420 | 10.9% |
| 39 | Virginia Beach, VA | $1,190 | 19.0% | $1,330 | 12.7% |
| 40 | Cleveland, OH | $1,180 | 25.5% | $1,300 | 30.0% |
| 41 | Tampa, FL | $1,180 | 4.4% | $1,410 | 6.0% |
| 42 | Fresno, CA | $1,160 | 17.2% | $1,380 | 15.0% |
| 43 | Milwaukee, WI | $1,140 | 1.8% | $1,320 | 12.8% |
| 44 | Boise, ID | $1,130 | 13.0% | $1,270 | 11.4% |
| 45 | Chesapeake, VA | $1,120 | 2.8% | $1,250 | 3.3% |
| 46 | Aurora, CO | $1,100 | 0.0% | $1,430 | 1.4% |
| 47 | Durham, NC | $1,090 | 6.9% | $1,250 | 10.6% |
| 48 | Madison, WI | $1,090 | -5.2% | $1,390 | 5.3% |
| 49 | Houston, TX | $1,080 | 4.9% | $1,340 | 6.3% |
| 50 | Pittsburgh, PA | $1,080 | -10.7% | $1,300 | -5.8% |
| 51 | Reno, NV | $1,080 | 3.8% | $1,390 | 10.3% |
| 52 | Colorado Springs, CO | $1,070 | 7.0% | $1,350 | 10.7% |
| 53 | Fort Worth, TX | $1,050 | 2.9% | $1,360 | 8.8% |
| 54 | Raleigh, NC | $1,050 | 5.0% | $1,250 | 4.2% |
| 55 | Buffalo, NY | $1,040 | -8.8% | $1,110 | -18.4% |
| 56 | Irving, TX | $1,040 | -4.6% | $1,370 | -3.5% |
| 57 | Chattanooga, TN | $1,030 | 14.4% | $1,180 | 14.6% |
| 58 | Las Vegas, NV | $1,030 | 8.4% | $1,210 | 4.3% |
| 59 | Norfolk, VA | $1,020 | 10.9% | $1,100 | 14.6% |
| 60 | Rochester, NY | $1,020 | 9.7% | $1,210 | 10.0% |
| 61 | Indianapolis, IN | $1,000 | 22.0% | $1,050 | 16.7% |
| 62 | Phoenix, AZ | $1,000 | 2.0% | $1,280 | 3.2% |
| 63 | Salt Lake City, UT | $1,000 | -13.0% | $1,300 | -6.5% |
| 64 | St Louis, MO | $1,000 | 22.0% | $1,260 | 9.6% |
| 65 | Kansas City, MO | $990 | 5.3% | $1,170 | 14.7% |
| 66 | Mesa, AZ | $970 | 7.8% | $1,210 | 9.0% |
| 67 | Jacksonville, FL | $960 | 6.7% | $1,140 | 11.8% |
| 68 | Anchorage, AK | $950 | 5.6% | $1,150 | 4.5% |
| 69 | Cincinnati, OH | $940 | 4.4% | $1,130 | -3.4% |
| 70 | Glendale, AZ | $940 | 1.1% | $1,170 | 10.4% |
| 71 | San Antonio, TX | $930 | 5.7% | $1,150 | 4.5% |
| 72 | Arlington, TX | $900 | 4.7% | $1,180 | 7.3% |
| 73 | Spokane, WA | $890 | 17.1% | $1,100 | 6.8% |
| 74 | Corpus Christi, TX | $880 | 7.3% | $1,130 | 8.7% |
| 75 | Des Moines, IA | $880 | 2.3% | $930 | 3.3% |
| 76 | Louisville, KY | $880 | 6.0% | $940 | 1.1% |
| 77 | Detroit, MI | $860 | 19.4% | $1,030 | 25.6% |
| 78 | Columbus, OH | $850 | 6.3% | $1,090 | 3.8% |
| 79 | Knoxville, TN | $850 | 4.9% | $1,000 | 6.4% |
| 80 | Memphis, TN | $830 | 7.8% | $880 | 8.6% |
| 81 | Syracuse, NY | $830 | 2.5% | $970 | -3.0% |
| 82 | Bakersfield, CA | $810 | 0.0% | $1,060 | 14.0% |
| 83 | Omaha, NE | $810 | 1.3% | $1,040 | 4.0% |
| 84 | Winston Salem, NC | $810 | 1.3% | $880 | 6.0% |
| 85 | Augusta, GA | $800 | 6.7% | $900 | 7.1% |
| 86 | Baton Rouge, LA | $800 | 5.3% | $920 | 4.5% |
| 87 | Greensboro, NC | $800 | 11.1% | $920 | 13.6% |
| 88 | Tallahassee, FL | $800 | -3.6% | $940 | 4.4% |
| 89 | Albuquerque, NM | $780 | 11.4% | $950 | 14.5% |
| 90 | Lincoln, NE | $780 | -3.7% | $920 | 0.0% |
| 91 | Oklahoma City, OK | $760 | 0.0% | $900 | 1.1% |
| 92 | Tucson, AZ | $760 | 13.4% | $1,000 | 14.9% |
| 93 | Lexington, KY | $740 | 1.4% | $920 | -3.2% |
| 94 | El Paso, TX | $700 | 4.5% | $850 | 6.3% |
| 95 | Laredo, TX | $690 | -2.8% | $950 | 0.0% |
| 96 | Shreveport, LA | $660 | 1.5% | $740 | 5.7% |
| 97 | Tulsa, OK | $660 | 3.1% | $830 | 0.0% |
| 98 | Lubbock, TX | $650 | 0.0% | $820 | 2.5% |
| 99 | Wichita, KS | $640 | -4.5% | $730 | 4.3% |
| 100 | Akron, OH | $580 | -6.5% | $730 | 4.3% |