John Walkup
Talking Manhattan on UrbanDigs.com
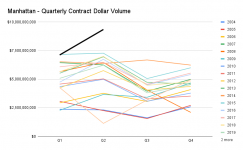
Check this out - the dollar volume of signed contracts in the 2Q of 2021 is a record by far. Moreover, look at the slope from q1 to q2 - it's also the mot intense on record..... it's nuts out there, right now.... BUT since 2004, only 3 years have seen $ vol increase from q2 to q3. One of those years was 2020 as it went from nothing to something. Otherwise, the historical trend says relax.
Note - chart cut off legend.. safe to say the steep black line at the top is 2021 and the orange line dragging along the bottom is 2020.

Note - chart cut off legend.. safe to say the steep black line at the top is 2021 and the orange line dragging along the bottom is 2020.
